
Gordon Parks Muhammad Ali in training 1966
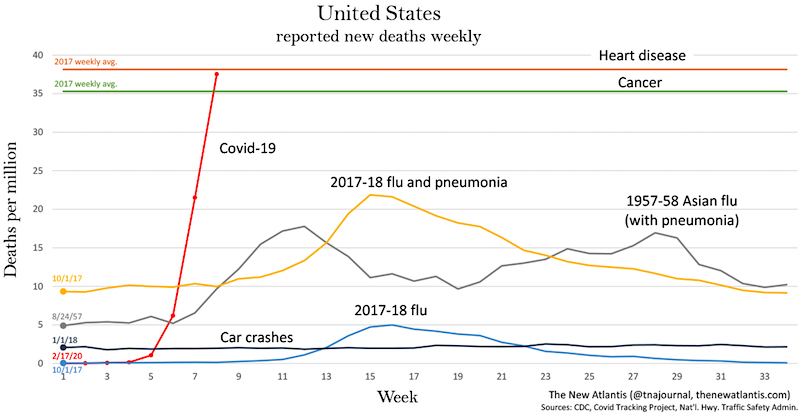
There are times when you think: now things must be easy to comprehend, but as it turns out, they are still not. Let me try once more. See, I was thinking it must have become much easier to gauge the impact in the US of COVID19 when I published the graph below from TheNewAtlantis.com a few days ago. That the stories about seasonal flu etc. at least should be dead and buried, because, well, just look at the graph.
No such “luck”. That warped comparison keeps on rearing its head. The graph is plenty clear about it, however. In a period of about 3 weeks, COVID19 obliterated all other causes of death far behind.
click to enlarge in new tab

I have followed the progress of the virus since early January, so plenty of graphs are available. Below are those from Worldometer and SCMP, starting February 20.
On February 2, the US had 5 cases and zero deaths. Then we get to the graphs.
On February 20, there were 75,750 global cases, 74,500 of which were in China. There were 2,130 deaths, of which just maybe 10 were outside China.
The US had fewer than 15 cases and zero deaths.
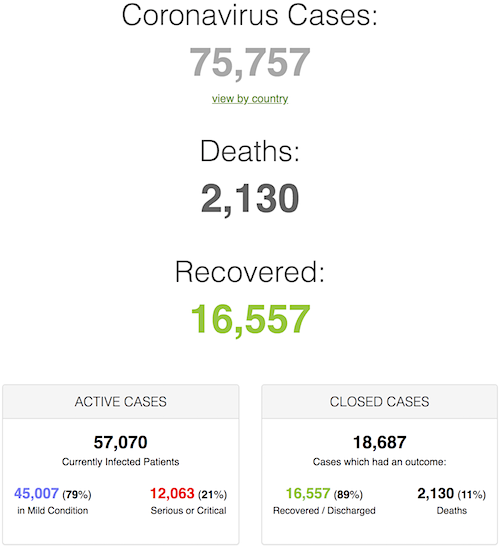
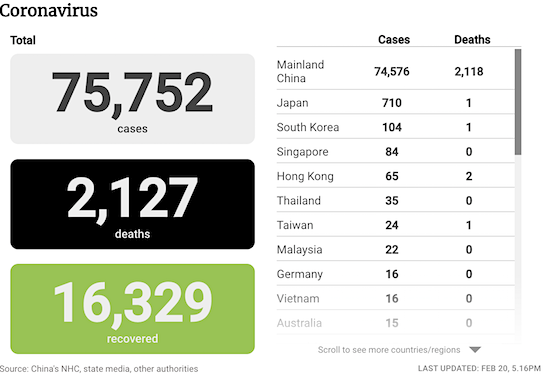

One month later, things had changed quite dramatically, or so it seemed.
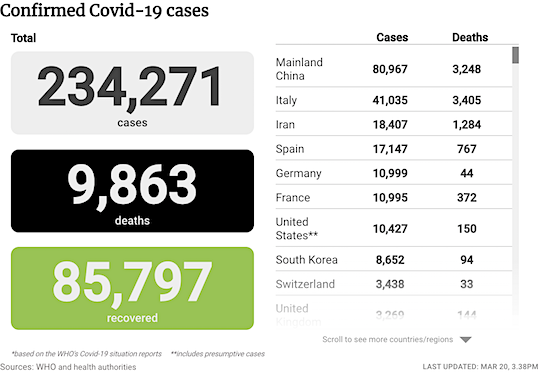
On March 20, there were 250,000 global cases and over 10,000 deaths. Cases had tripled, deaths had almost quintupled. Italy had overtaken China in most fatalities, from zero a month earlier.
The US had emerged “on the forefront”. It now had 10,400 cases and 150 deaths. Yes, that is just one month ago, 32 days to be exact.
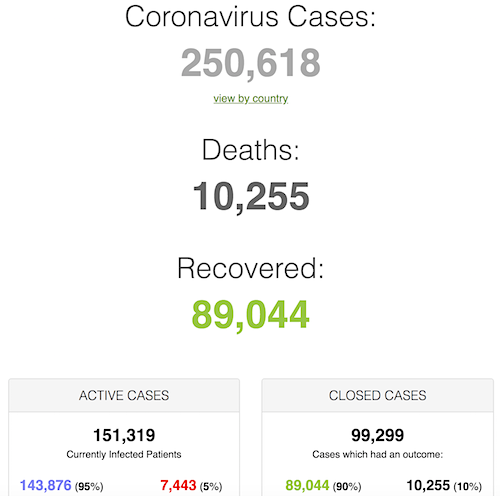

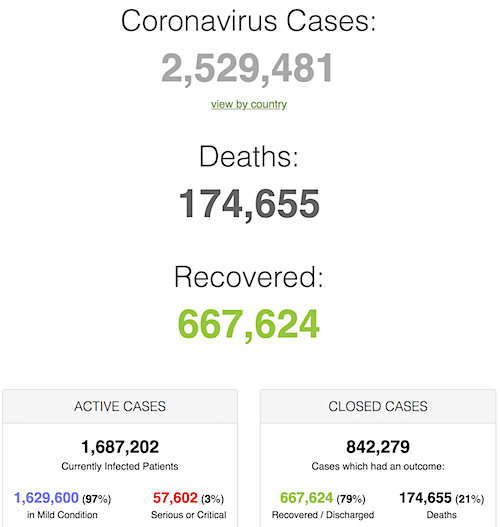
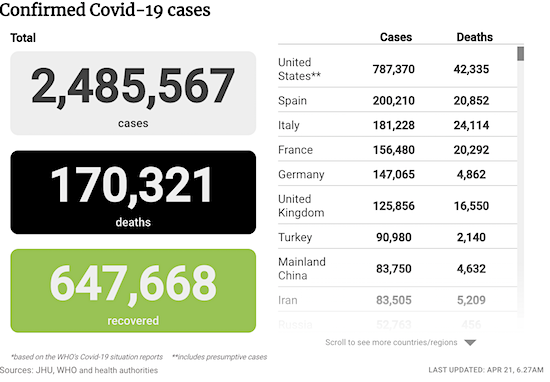
Today, on April 21 2020, you would hardly recognize the situation as it was on February 20 or March 20.
There are now over 2,500,000 cases and over 172,000 deaths.
The US has become the frontrunner, and by a very large margin. It has over 800,000 cases and over 43,000 deaths.
From those 10,400 cases and 150 deaths 32 days ago.
Moreover, of those 43,000 deaths, almost half, 20,000, died in just the past 7 days.
And it’s at this point that people want to call the peak.

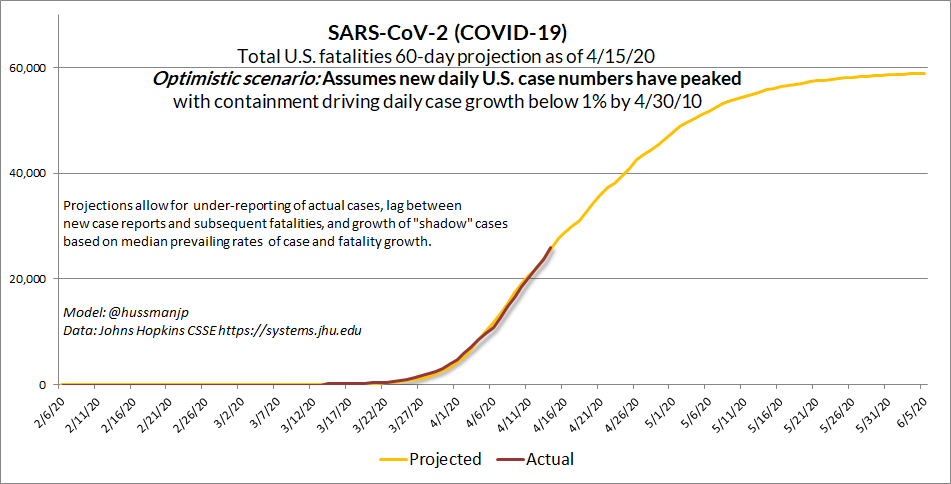
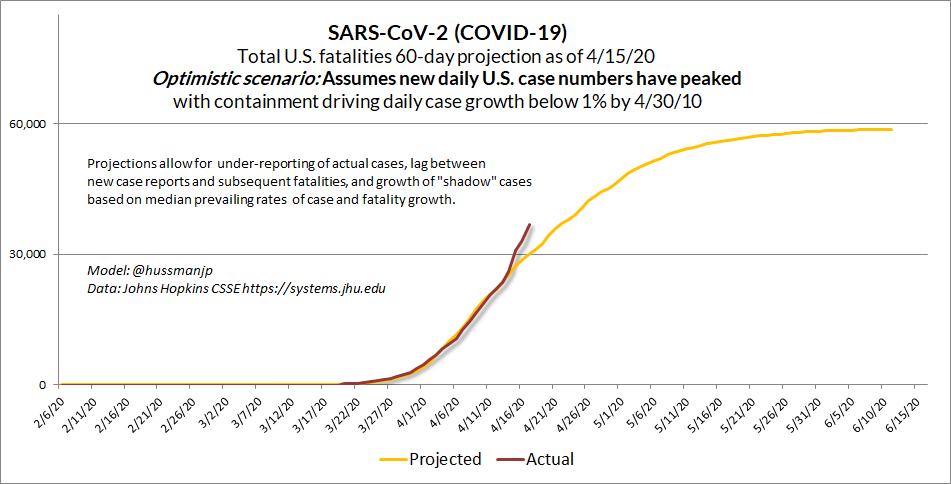
Investor John Hussman developed a model from early February which he’s been updating ever since. His model followed (or actually, predicted) actual numbers quite well:
Apr 15 (637,716 cases, 30,826 deaths): Assuming sustained containment efforts, the “optimistic” projection (my adaptive model) suggests that U.S. daily new cases may have peaked. This does NOT mean these efforts can now be abandoned. Most U.S. fatalities are still ahead, and we still lack capacity to test/track/trace.
But 5 days ago, John started getting worried:
Apr 16 (667,801, 32,917): This isn’t good. U.S. fatalities just jumped off book. We shouldn’t see 31,000 yet.
Apr 18 (735,076, 38,903): So much for the optimistic scenario. We’re way off book. I had hoped this was just a one-time adjustment. Understand this:
PEAK daily new cases in a containment scenario is also PEAK infectivity if containment is abandoned at that moment.

I’ve long said that people are social animals, and you cannot -and shouldn’t- keep them apart for too long. But at the same time, containment measures in case of epidemics go back a very long way in history. And it’s very well for people to develop models that appear to show that the virus will do whatever it can until it no longer does, and it will soon disappear even if we didn’t do anything to prevent it from spreading.
But those are still just models, just like the one John Hussman developed. And until they are proven, which takes time, the actual numbers we have now speak loudly. Globally, we went from 250,000 to 2,500,000 cases in one month, and from 10,000 fatalities to 172.000. In the US in that same month we went from 10,400 cases to over 800,000 and from 150 deaths to 43,000.
“PEAK daily new cases in a containment scenario is also PEAK infectivity if containment is abandoned at that moment”, says Hussman. Of course everybody wants their freedom back. But at what price? If you don’t, because you can’t, know what the price will be, are you still willing to pay that price?
What I mean is, everyone’s trying to call a peak, but for most that’s merely because they want there to be a peak. The numbers don’t really say that; they may seem to do, but that’s just over 1,2 or 3 days at best. While half of all US fatalities have been over the past 7 days.
If the peak has really already occurred, we will not know it until about 10-14 days from now. So the only thing we can do is to wait that long. Perhaps it would be a good idea to listen to what those have to say who are so enthusiastically labeled “heroes” all over the globe, the doctors, nurses and other frontline caretakers.
If they are indeed your heroes, and that’s not just some empty phrase, listen to what they have to say about the pressure on them, on the system they work in, on the numbers of cases and deaths they see themselves confronted with.
But also listen when they say things you may not like to hear. If anybody deserves a relaxation of a lockdown, and of pressure overall, surely it must be them, before you.
Guess it’s too much to ask that perhaps you may have learned some lessons lately, about things that you don’t need to do but that you always did. Or to ask you if you heard the birds singing louder in the bluer skies this morning.
Just out of curiosity: Did you know that Anne Frank spent 2 whole years locked down behind a wall?

We would like to run the Automatic Earth on people’s kind donations. Since their revenue has collapsed, ads no longer pay for all you read, and your support has become an integral part of the process. You can donate on Paypal or Patreon, which you find at the top of the right- and left sidebars on this page.
Thanks everyone for your generosity to date.

Support the Automatic Earth. It’ll do you good.


